‘Quid Pro Quo’? A Former U. of Minnesota Regent Is the Sole Finalist for a Campus’s Interim Chancellorship
Chronicle of Higher Education | July 8, 2022 by Megan Zahneis
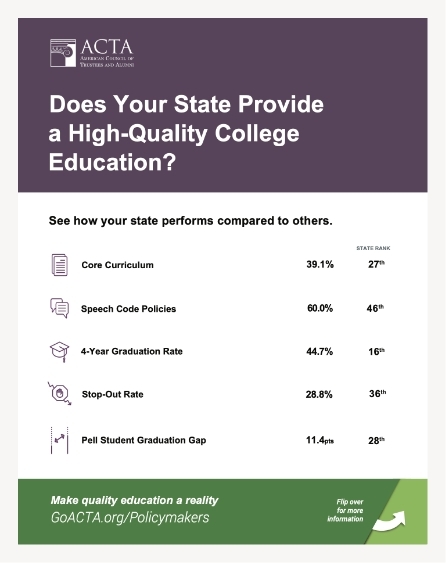
Does your state provide an intellectually rich, high-quality college education at an affordable price? See how your state is doing compared to others.
Unless otherwise indicated, data from this state rankings survey include all regionally accredited, public four-year institutions with a stated liberal arts mission. ACTA’s survey does not include institutions with a vocational, technical, or otherwise narrow mission focus. Data are drawn from the National Center for Education Statistics’ (NCES) Integrated Postsecondary Education Data System (IPEDS) unless otherwise specified.
15.51%
29
Percentages are calculated by dividing what institutions report to IPEDS as “Published in-state tuition and fees” by the state median household income reported by the American Community Survey. To calculate percentages, dollar values are inflation-adjusted using the CPI-U-RS annual average. Values are based on weighted averages using undergraduate enrollment (“Reported full-time equivalent (FTE) undergraduate enrollment”) so that schools that serve a larger percentage of students within the state contribute more to the state’s average. Higher rankings correspond with lower percentages.
1.17:1
7
The Administrator-to-Professor Ratio is calculated by dividing the statewide sum of what institutions report to IPEDS as full-time “Managers,” “Business and Financial Operations” staff, and “Office and Administrative Support” staff by the statewide sum of what institutions report as full-time instructors with academic ranks of “Professors,” “Associate Professors,” and “Assistant Professors.” Higher rankings correspond with lower ratios (fewer administrators for each professor).
48.3%
29
The Student Share of Revenue is calculated by the State Higher Education Executive Officers Association. Their definition reads: “The student share is a measure of the proportion of total education revenue at public institutions that comes from students and their families (measured as net tuition revenue). Net tuition revenue used for capital debt service is included in net tuition revenue, but excluded from total education revenue in calculating this figure. Sector-level total education revenue includes any portion of federal stimulus funding allocated specifically to each sector.” For the purposes of this survey, only four-year institutions are included in this calculation.
$4,940
37
Spending amounts are calculated using what institutions report to IPEDS as “institutional support” expenses, or those for the “day-to-day operational support of the institution.” Institutional support commonly includes costs for executive management, legal departments, fiscal operations, public relations, and development. To calculate administrative spending on a per-student basis, the total state spending is divided by the “Full-time equivalent enrollment (Fall enrollment derivation)” variable reported in IPEDS. Higher rankings correspond with lower amounts of per-student spending.
[Note: Some institutions that operate multiple campuses choose to report spending data in a single record (usually the main campus). In these rare cases, we divided the total spending by all students within the system, even students at schools outside of our survey, to account for the total per-student spending.]
$20,206
15
Each state’s Graduate Debt is calculated by weighting each institution’s most recent class’s median federal debt by the corresponding number of graduates with federal loans, both found in College Scorecard. The Graduate Debt is the cumulative amount of federal debt for the sum of their education, and only for loans that have originated at the institution. The student debt does not include PLUS loans or other loans for the parents of undergraduates.
36.0%
31
The Core Curriculum ranking is determined using ACTA’s What Will They Learn?® (WWTL) project. WWTL grades colleges and universities on an “A”–“F” scale based on how many of the following seven core subjects they require in their general education programs: Composition, Literature, (intermediate) Foreign Language, U.S. Government or History, Economics, Mathematics, and Natural Science. To calculate a state’s average, the Core Curriculum ranking converts the WWTL grades to numerical values using the standard college GPA system (A = 4.0, B = 3.0, etc.). Values are weighted by undergraduate enrollment so that schools that serve a larger percentage of students within the state contribute more to the state’s average. Higher state rankings correspond with higher average GPAs.
52.6%
48
The Speech Code ranking is based on the Foundation for Individual Rights in Education’s (FIRE) Spotlight Database, which assigns a “red light,” “yellow light,” or “green light” rating to institutions based on the extent to which their policies restrict free speech. To calculate a state’s average, the Speech Code ranking converts FIRE’s ratings to numerical values (1= “red light,” clear and substantially restrictive; 2= “yellow light,” some limited restrictions; 3 = “green light,” no serious restrictions). Values are weighted by undergraduate enrollment so that schools that serve a larger percentage of students within the state contribute more to the state’s average. Institutions in ACTA’s survey that are not rated by FIRE are assigned a null rating so as not to affect a state’s average. Moreover, the Speech Code ranking is reflective of institutions’ written policies, not necessarily their practices. Higher rankings correspond with higher average values.
48.4%
13
The 4-Year Graduation Rate ranking uses data drawn from the NCES’ College Navigator website for first-time, full-time freshmen pursuing bachelor’s degrees. The state ranking is created by averaging each school’s graduation rate weighted by undergraduate enrollment.
10.5%
3
The state Stop-Out Rate is calculated from the cohort data of the IPEDS Graduation Rates survey by dividing the state’s total number of bachelor’s degree-seeking students in the “No longer enrolled” variable by the state’s total number of students in the “Adjusted cohort (revised cohort minus exclusions)” variable. The adjusted cohort excludes students who have left the institution for reasons unrelated to the schooling (i.e., died or become permanently disabled, drafted into the military, left to serve with a foreign aid service of the Federal Government). Students in the “no longer enrolled” variable are categorized as those who—six years after entering their institution—have not completed a bachelor’s degree, are not still enrolled at their first institution, have not enrolled in another institution, or have not left for any of the reasons which would have removed them from the adjusted cohort.
11.2pts
26
To calculate the Pell Student Graduation Gap, each state’s six-year graduation rate is calculated by dividing the total number of students who received a bachelor’s degree in six years by the “adjusted cohort,” or the total number of students who began six years ago, as reported to IPEDS. Students who did not graduate for non-academic related reasons (deployed, transferred, or died) were removed. The six-year graduation rate for Pell Grant recipients was calculated the same way, using only students who received the Pell Grant. The Pell Student Graduation Gap is the difference between the state’s six-year graduation rate and the Pell Grant recipients’ six-year graduation rate.
In At a Crossroads: A Report Card on Public Higher Education in Minnesota, a 2010 report published by ACTA in partnership with the Freedom Foundation of Minnesota, ACTA assesses institutions on measures of academic strength, intellectual diversity, cost effectiveness and governance.
ACTA in the NewsPresidential Search
Chronicle of Higher Education | July 8, 2022 by Megan Zahneis
A University of Minnesota regent who resigned his position in order to be […]
Launched in 1995, we are the only organization that works with alumni, donors, trustees, and education leaders across the United States to support liberal arts education, uphold high academic standards, safeguard the free exchange of ideas on campus, and ensure that the next generation receives an intellectually rich, high-quality college education at an affordable price.
Discover MoreSign up to receive updates on the most pressing issues facing our college campuses.